Applying Self-Referential Grades to NFL Quarterback Play
A practical method to isolate individual performance from noisy play-by-play data
Across all major sports, numbers lie the most in american football, especially at the quarterback position. Two years ago, Tua Tagovailoa led the NFL in passing yards. Today, his $200M contract is considered one of the worst in the sport. Conversely, Sam Darnold was an unimportant journeyman before being thrust into the starting role for the Vikings in 2024. Despite putting up top-ten counting statistics across the board, Darnold did not receive an offer to return to the team and instead signed in Seattle for only $30M annually, less than 60% of the salary of the league's top QBs. It can be hard to know how good a player is based on their numbers alone at the position. The goal of this project is to measure QB performance through advanced metrics and filter those raw statistics through a grading system that evaluates how complete a player's skillset is. Factors in the grading system include one's ability to throw accurately across the entire field, maintain success passing even when it is expected, and avoid declining efficiency when their team is close to the endzone. By analyzing the relationship between raw performance and grading results, we can improve our understanding of who is elevating their lackluster situation versus whose situation is elevating their performance metrics.
Poster Board
Below is the poster board I presented at KSU Analytics Day in November 2025 as an honors contract affilated with my studies in DATA 3010: Computer Applications of Statistics.
Further Updates
Since presenting the project at Analytics Day, I have made some additional refinements to the grading model with the goal of maximizing fairness and eliminating uneven environmental factors. One such factor is the strength of the defenses that each QB faced. For the given testing window, all 32 defenses were graded based on their percentile in our three notable statistical categories (EPA, SR, and CPOE)[What are these metrics?]. From there, each QB was assigned a "Strength of Defense" (SoD) score based on the weighted average of the defenses they played combined with their number of plays against each team. Finally, a multiplier score for SoD is assigned based on a sigmoidal transformation of the QB's SoD normalized around 1.
Another refinement made to the model involved normalizing grading schemes for redzone on-off efficiency, which I listed as an element of my original presentation that could have used some refining. Now, the value is normalized around a mean value of 0.5 as well, which gives it equal weight as the other criteria.
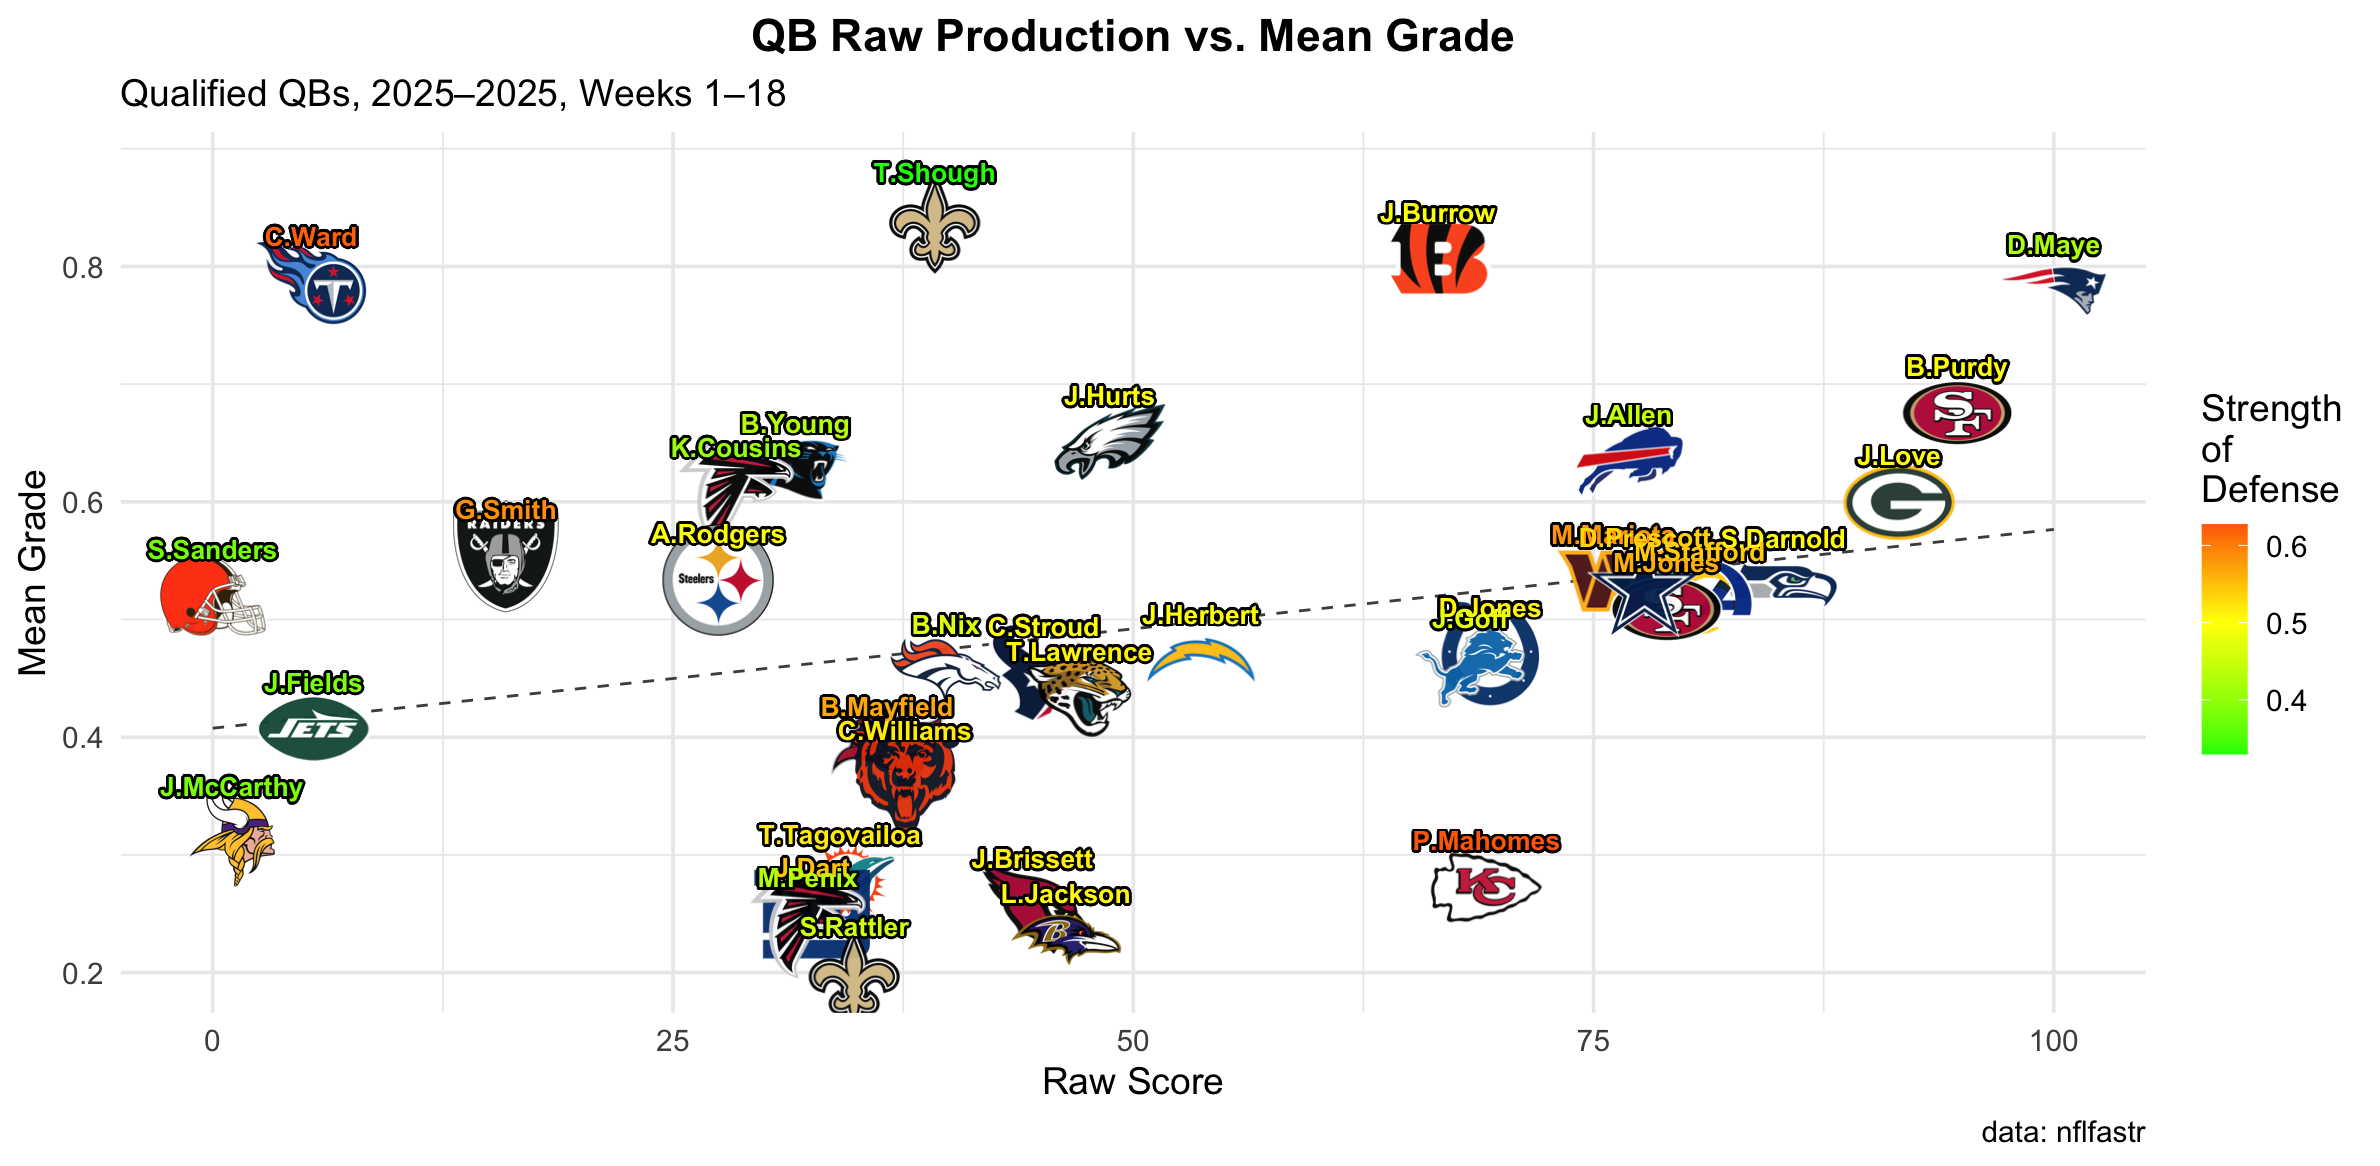
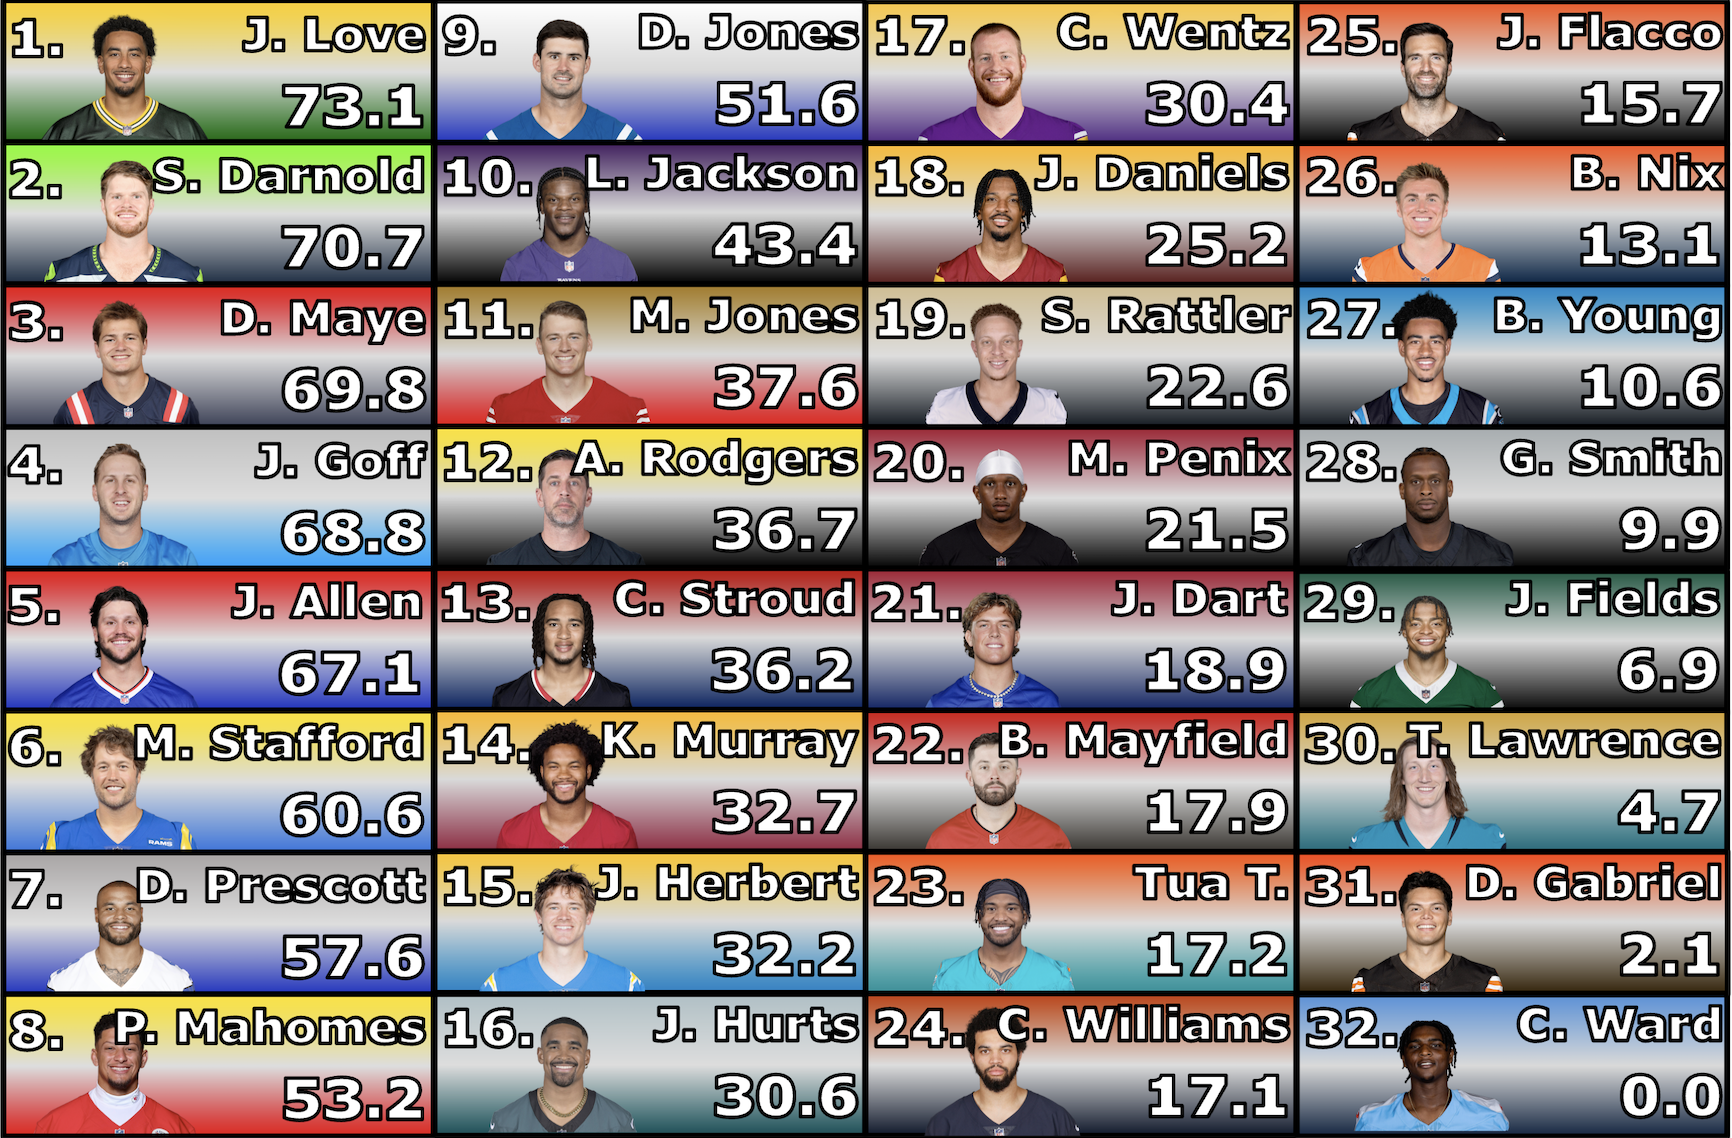
Figure 2: Final 2025 NFL QB rankings plotted by raw production and grading relative to production
(Click to expand)
- Drake Maye should have been league MVP. Although his defensive schedule was below-average, his adjusted score of 71.0 was nearly 7 point clear of second place. His numbers were eye-popping, of course, but he passed the "smell test" in each of my under-the-hood grading criteria as well.
- Some players struggle because of a poor situation. Some struggle because they're simply not equipped to be a top QB. This distinction can be made through the lens of two rookie QBs, Cam Ward and Shedeur Sanders. Although both young men posted poor statistics on their premier campaign, the on-field product showed Ward as a talented player surrounded by a low-level roster that impeded his production, whereas Sanders' down-to-down consistency was a serious issue and Cleveland's offense often looked dead in the water. My grading criteria noticed the same differences, recognizing Ward for showing positive signs in key indicators and giving grace for an exceptionally tough schedule. On the other hand, Sanders' grades were generally unexciting despite an easier schedule.
- Empty calories aren't worth much. Players such as Jacoby Brissett and Spencer Rattler posted decent numbers during their limited starting tenures this season, but the weaknesses in their game were revealed by bottom-five mean grades. These two players were not condusive to winning in 2025, going a combined 2-18 as starters this past season, and their grading results agree.
The Code
If you would like to learn more about this project, you may view and download the code for yourself using the button below. Thanks for reading!