Evaluating QB EPA Progression Through Time-decay Weighted Averages
A model inspired by the NBA's DARKO DPM statistic that balances recent performance with wholistic evaluation.

In a sport that experiences extreme variance on a year-over-year and game-over game basis such as football, normalization of performance can be extremely valuable. As such, the goal of this project is to provide stability in the statistical evaluation of NFL quarterbacks in a manner that accounts for past performance while giving more weight to recent improvements or struggles. Analysts in NBA circles have been searching for a solution to a similar question regarding night-to-night performance prediction for years, and have found an answer in a metric known as DARKO DPM, a machine learning-driven prediction model that utilizes expoential decay and Kalman filters to weigh history against the present in player evaluation. I developed a similar (although simpler for now) model in the same philosophy of DARKO DPM for quarterback play.
Methodology
Using EPA/play[What's this?] on all plays including passes, rushes, and penalties for NFL quarterbacks as my measure of overall performance, I developed an exponential smoothing model to weight each snap of a player's career at any given point. The weight of each play is determined by the following formula:
Where:- represents the rate of decay (constant at 0.01 in this experiment).
- represents the total number of plays in the sample.
- represents the index of the specific play being weighted.
- represents the calculated weight assigned to play .
If you want to learn more about DARKO DPM, you can read about it here.
- Data Source: nflfastR package (2017-2025 postseason data).
- Tools: dplyr for data processing, ggplot2 for visuals.
Results and Analysis
To demonstrate this algorithm at work, let's compare the playoff careers of three star QBs: Josh Allen, Patrick Mahomes, and Lamar Jackson. The stories of these players' postseason performance could not be less alike: Mahomes, with three super bowl rings to his name, has earned praise for his play in January and February rivaled only by Tom Brady. Allen has played well in the playoffs, but has yet to appear in a single super bowl. Lastly, Jackson's playoff career got off to a disastrous start that has since improved but remains underwhelming for a two-time MVP.
Let's examine Allen's performance on its own. Each dot on the chart represents Allen's weighted average EPA/play after each play of his postseason career. Since the sample size is small enough in the playoffs, individual games are separated via dashed lines, with each point colored to match the opposing team. The first 10 plays are visually omitted from the graph to give the average a moment to normalize, but still factor into the calculations themselves.
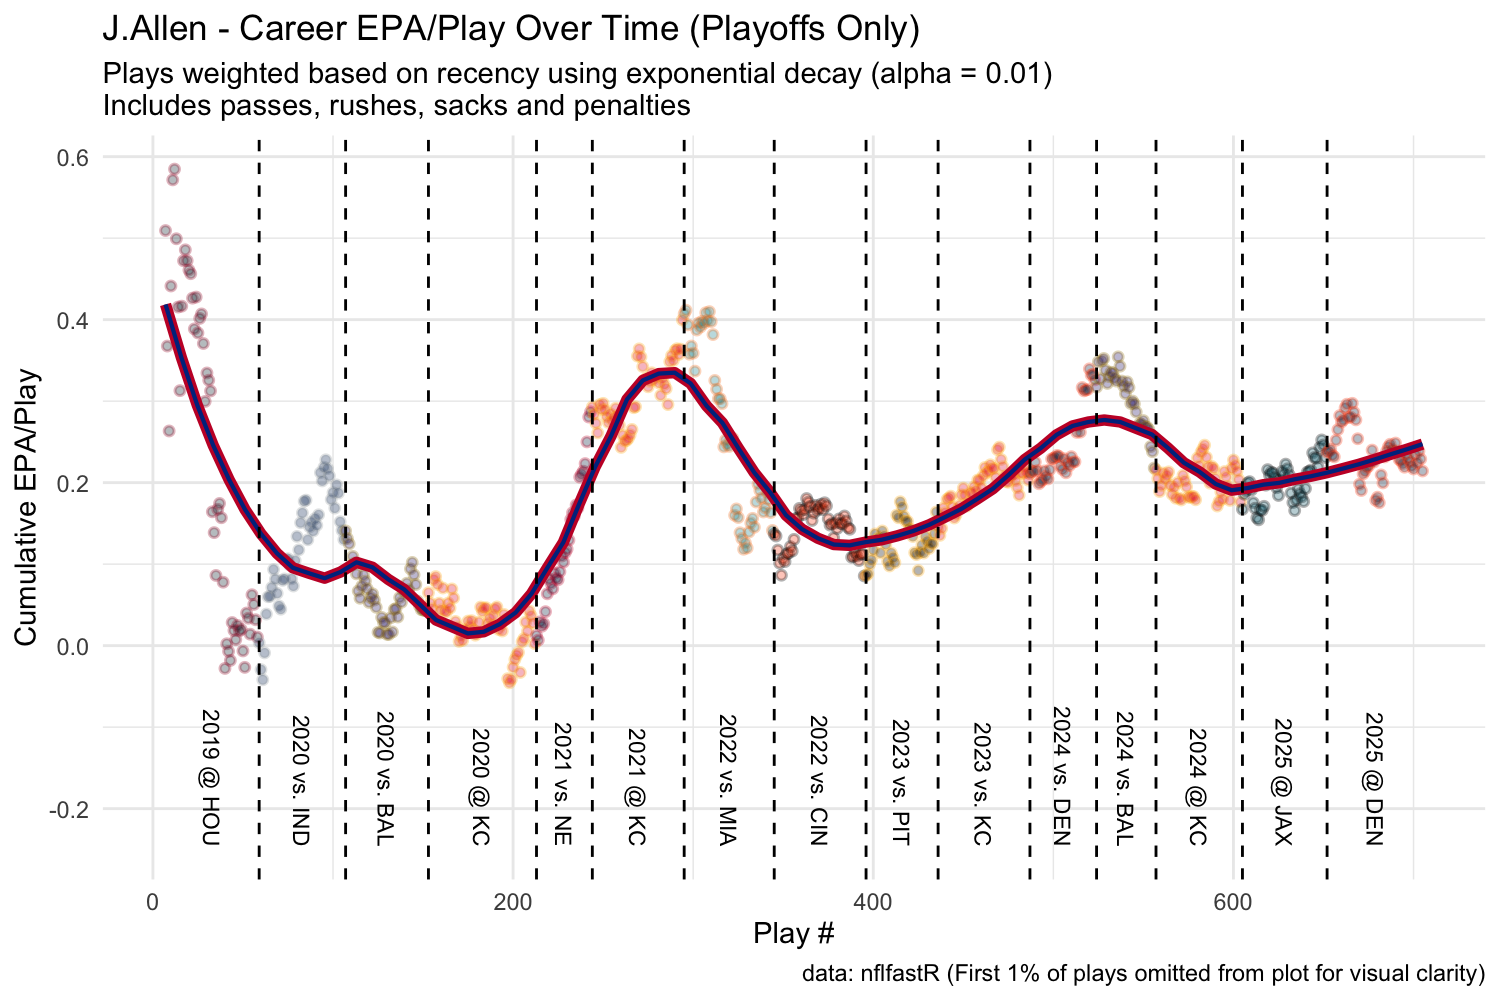
Figure 1: Individual weighted career postseason EPA/play progression for Josh Allen with a LOESS curve applied
The chart corroborates Allen's reputation as an exceptional playoff performer, highlighted by a 2021 playoff run where he contributed a staggering 54.5 total points of EPA across two games. Despite a disappointing exit in the second round of the 2025 postseason, Allen's weighted average EPA/play of over 0.2 stands as an all-time metric.
By exporting the LOESS curve from the individual charts of our three QBs and placing them on the same plane, we can evaluate the progression of their playoff careers side-by-side.
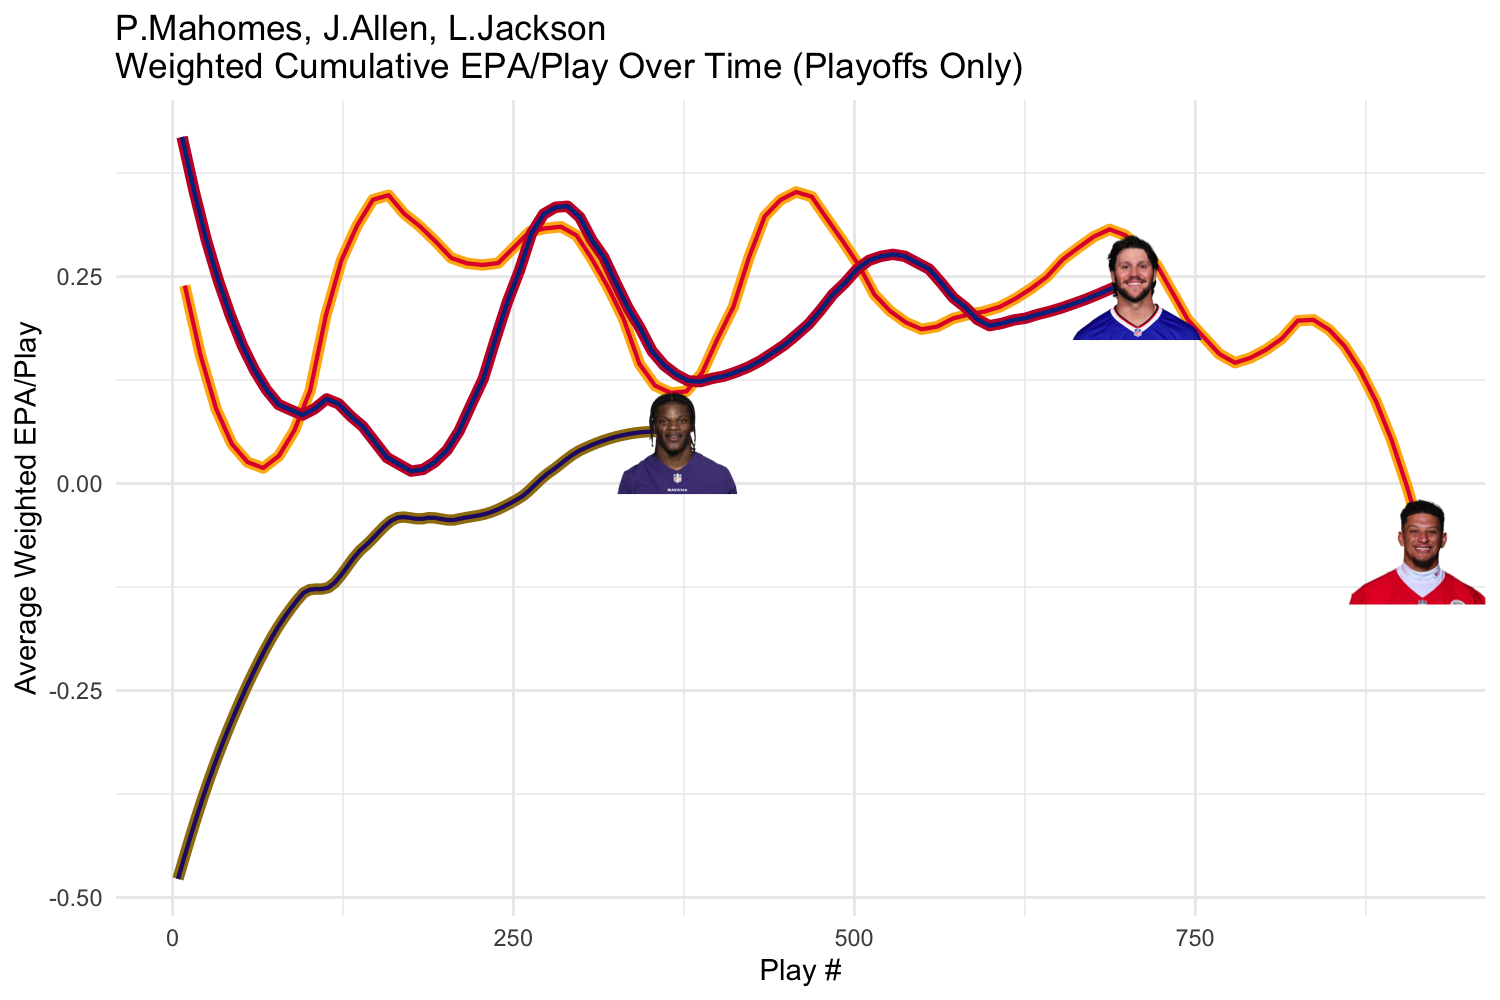
Figure 2: Smoothed curves of weighted career postseason EPA/play progression for Josh Allen, Patrick Mahomes, and Lamar Jackson
The discrepancy in experience quickly presents itself here, with Jackson's sample size being about half of that of his peers. Regardless, the visualization of the data makes it easy to view these men's playoff careers through a wholistic lens. After a horrendous postseason debut, Jackson has steadily improved, although his peak weighted average remains below both his peers at any equal point in their respective careers. Mahomes's weighted average has taken a nosedive following a rough outing in his Super Bowl LIX defeat at the hands of the Philadelphia Eagles.
Future Improvements
Although an alpha value of 0.01 provides a good balance for the example discussed in this article, I would like to develop a formulaic approach to alpha determination in future iterations of this project. A larger sample size, such as a regular season career for a 10-year veteran, would require a smaller alpha value or else plays older than a couple seasons would hold practically no weight in their evaluation. I plan to revisit this project soon to do exactly that.
The Code
If you would like to learn more about this project, you may view and download the code for yourself using the button below. Thanks for reading!